System components monitoring#
Controller nodes are isolated by default, which thus means that a cluster user cannot schedule workloads onto controller nodes.
k0s provides a mechanism to expose system components for monitoring. System component metrics can give a better look into what is happening inside them. Metrics are particularly useful for building dashboards and alerts. You can read more about metrics for Kubernetes system components here.
Note: the mechanism is an opt-in feature, you can enable it on installation:
```shell
sudo k0s install controller --enable-metrics-scraper
```
Jobs#
The list of components which is scrapped by k0s:
- kube-scheduler
- kube-controller-manager
Note: kube-apiserver metrics are not scrapped since they are accessible via kubernetes endpoint within the cluster.
Architecture#
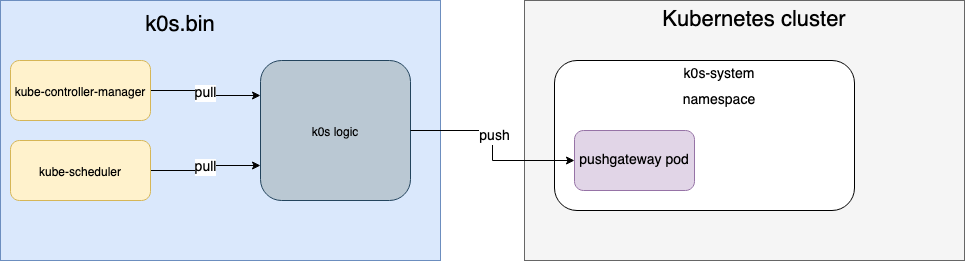
k0s uses pushgateway with TTL to make it possible to detect issues with the metrics delivery. Default TTL is 2 minutes.